Table of Contents
- Overview
- Introduction
- Part I: Setting up SPECFEM3D_GLOBE
- Part II: Continental-scale Simulations
- Part III: Visualization
- Part IV: Adjoint Simulations (Bonus)
- Further Work
- Resources
Part III: Visualization
In this third part of the tutorial, we will look at methods for visualizing the output simulation data. We will look at the following categories:
- Visualize Seismograms
- Visualize Model Mesh
- Visualize Surface Movie
Visualize Model Mesh
In order to visualize the model mesh, we need to modify the Par_file such
that the mesh data are being saved. Therefore, open up DATA/Par_file and set
the following parameter to .true.:
  ...

  # save mesh files to check the mesh
  SAVE_MESH_FILES                 = .true.

  ...
Once we have updated this parameter, we need to go through the following three steps in order to visualize the model mesh:
- Rerun the mesh routine
- Combine the output mesh data
- Visualize using Paraview
-
Step 1: Rerun the mesh routine
This step is identical to what we did in Part II. We run the
xmeshfem3Dexecutable on the cluster by submitting thesubmit_mesherscript:
sbatch submit_mesher
And use squeue to monitor the job. Once the job finishes, we can check the
OUTPUT_FILES/output_mesher.txt file to make sure that the mesher ran
successfully, and then we can move on to the next step.
-
Step 2: Combine the output mesh data
Once we have rerun the mesh routine with the
SAVE_MESH_FILESparameter set totrue, the mesh files will be output to theDATABASES_MPI/folder. The data is partitioned among the processees, and we will want to combine these data into single files.We can achieve this by running the
combine_data.pyscript that is located in the root folder. This script will generateVTKfiles for thevpandvsmodel velocities which will be stored in theOUPUT_FILES/folder.NOTE: Under the hood, the
combine_data.pyscript is running thexcombine_vol_data_vtkexecutable that is located in thebin/folder. For details on how to run this executable directly, inspect thecombine_data.pyscript and consult the SPECFEM3D_GLOBE manual. -
Step 3: Visualize using Paraview
In order to start
Paraview, we first need to load the modulemodule load paraviewThen run the following command in the terminal to launch the program
paraviewOnce
Paraviewis running, click theOpenbutton in the top left corner, and navigate to theOUTPUT_FILES/folder. In this folder you should see two file-bundles calledreg_.._vp.vtkandreg_.._vs.vtk, which are the combined data files that we produced in the previous step. In order to visualize thevpvelocity model, press and hold thectrlkey and select the three filesreg_1_vp.vtk,reg_2_vp.vtk,reg_3_vp.vtk, and then clickOK.Now that we have loaded the model, click
Applyon the left-hand side in thePropertiesmenu, and the model will appear.In order to see the model mesh, select the three model files in the
Pipeline-Browserby holding downctrl. Then go to the top menu and selectFilter -> Common -> Group Datasets, and clickApplyin thePropertiesmenu. WithGroupDatasets1selected in thePipeline-Browsergo to the drop-down menu which saysSurfaceand selectSurface With Edges.The procedure is similar for visualizing the
vsvelocity model.
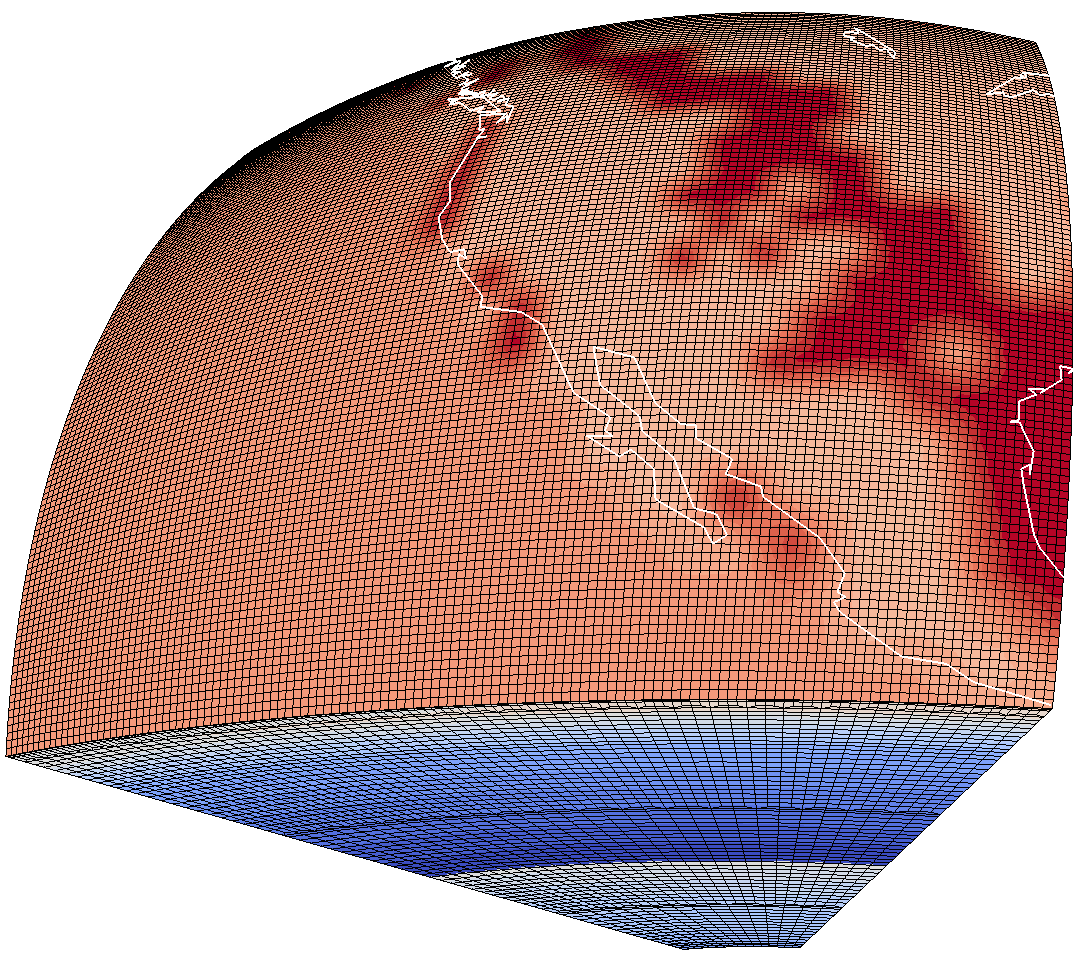
Visualization of the model mesh with the vp component.
In this section, we have looked at how to visualize the model mesh with different components (e.g. vp, vs).
In the next section, we will look at how to create a surface movie for the simulation data.